Hello
Ever thought what’s an interviewer’s favorite questions to rip you off – all of my previous post :).
And On-Chip Variation (OCV) is one of them, specifically for Static Timing Analysis interview. This analysis is coming from people who got interviewed and recruited into leading VLSI industries.
Most importantly, my posts and videos have helped most of them and I really feel proud about it. Nice feeling.
Coming back to analyze OCV, the first task is to find all possible sources variation, and find out how these can affect a delay of a cell and hence, timing.
First things first – Sources of variation
1) Etching
Look into the below layout of an inverter (which also shows the Width (W) and Length (L) parameters of an inverter)

And, a chain of inverters (this is mostly the case of clock path, be with me for upcoming posts and I will exactly let you know, why OCV is mainly applied on clock paths, 50% should be clear from the term “chain of inverters”)

We use photo-lithography fabrication technique to build the inverters on Silicon wafer, and this is a non-ideal process, where the edges will not exactly be straight lines, but there will be disturbances.
And why so, because the above technique needs photo-masks which are created using etching, which is again non-ideal. Below is how the ideal mask and real mask look like

Now these variations on the sides, is also dependent on what logic cell is present on either sides of this inverter, if its surrounded by chain of inverters on either sides, the variation on the sides will be less as the process parameters to build mask for a chain of similar size inverter, is almost the same.
But, if the inverters are surrounded by other gates, like flip-flops, then the variation will be more.
With that said, the below inverters in the middle will have a similar and less variations ……… (sentence continues after the below image)
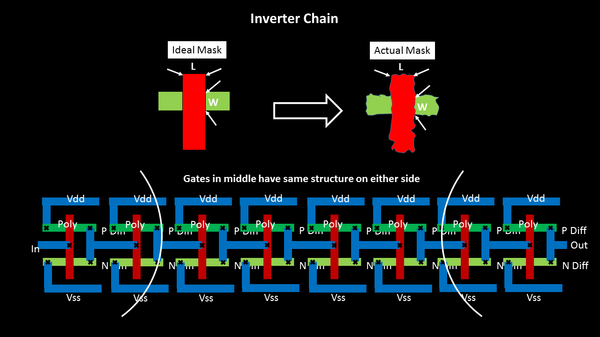
……(sentence continued from above) and the inverters on the boundaries will have different and more variations. (observe the difference in actual mask, in below and above image)
And guess what…. this directly impacts the drain current below, as it is proportional to (W/L) ratio

You feel, we are almost there…. not yet….we need to identify other sources of variation, find out how the current changes, and eventually, find out a range on what should be the value of OCV….
After this, do you feel, we are done …. not yet …. :), we need to use these OCV values, plug it in STA analysis and see its (+ve or -ve) impact….
Do you now feel, we are done …… Henry Ford correctly describes this “Anyone who stops learning is old, whether at twenty or eighty. Anyone who keeps learning stays young“
So, we will be never done :)… Stay Young .. Keep Learning … Look for my following post on OCV !!
Thanks
Kunal